Saturday, May 29, 2010

Paper: North Atlantic has Cooled over last Millenium

The paper Absolute chronologies from the ocean: Records from the longest-lived, non-colonial animals on Earth by Wanamaker et al studies a very long-lived clam (up to 3-4 centuries) common in the temperate to sub-polar North Atlantic Ocean. High resolution sections are taken from the shells to produce a sclerochronology using an oxygen isotope indicative of sea surface temperatures, as shown in red in the first graph below. The paper finds a cooling trend in the North Atlantic of approximately 2°C over the past milleneum:
figure from page 5
In addition, the reconstructed and measured sea surface temperatures in the 1940's and 1950's are found to be higher than the present. This paper may provide useful historical context for the recent, highly controversial paper on modern sea surface temperatures


Update: Another study in the same issue of PAGES news  (p. 37) of the North Atlantic sea surface temperatures using ocean sediments also shows temperatures to be higher in the 1940's and 1950's than the present and in the 1400-1500's than the present:

Thursday, May 27, 2010

NASA's Earth Energy Budget contradicts IPCC's

The cornerstone of the IPCC's theory of catastrophic anthropogenic global warming is the supposed increase of global temperature due to increasing "back radiation" by increasing greenhouse gases in the atmosphere. However, the concept of "back radiation" from greenhouse gases has been shown by numerous physicists to violate the first and second laws of thermodynamics. Simply stated, the second law of thermodynamics dictates “Warmth can never spontaneously pass from a body of lower temperature to a body of higher temperature” e.g. colder greenhouse gases back radiating to the earth. Even NASA has removed greenhouse gas back radiation from it's latest diagram of the earth's energy budget:


Whereas, the latest IPCC report shows greenhouse gas back radiation to represent 95% (324 W/m²) of the total incoming radiation (342 W/m²) from the sun:
Back radiation shown as 324 Wm-2 at lower right
Since heat is radiated from "greenhouse gases" in all directions, not just back to the earth, if the energy back radiated is 342 Wm-2, then an equal amount must also be radiated by GHGs to outer space (omitted from IPCC diagram), which would imply GHGs are radiating nearly double the energy input from the sun (i.e. a perpetual heat engine). Thus, the GHG "contribution" is off by a factor of two. The IPCC manages to "balance" it's unphysical energy budget via a number of arbitrary fudge factors which allow a large range of possible scenarios. This effectively "covers all the bases" and allows undue flexibility of computer models to derive any desired result due to greenhouse gas concentrations.

Wednesday, May 26, 2010

Paper: At least 60% of global warming since 1970 is natural

A new paper by Nicola Scafetta, Empirical evidence for a celestial origin of the climate oscillations and its implications, finds "that at least 60% of the global warming observed since 1970 has been induced by the combined effect of ... natural climate oscillations." and that "that climate may stabilize or cool until 2030-2040." Strong evidence is found for the well known 60-year climate cycle, as well as other cycles linked to astronomical origin. The paper concludes that current climate models "are missing fundamental mechanisms that have their physical origin in astronomical phenomena..."


Abstract: We investigate whether or not the decadal and multi-decadal climate oscillations have an astronomical origin. Several global surface temperature records since 1850 and records deduced from the orbits of the planets present very similar power spectra. Eleven frequencies with period between 5 and 100 years closely correspond in the two records. Among them, large climate oscillations with peak-to-trough amplitude of about 0.1°C and 0.25°C, and periods of about 20 and 60 years, respectively, are synchronized to the orbital periods of Jupiter and Saturn. Schwabe and Hale solar cycles are also visible in the temperature records. A 9.1-year cycle is synchronized to the Moon's orbital cycles. A phenomenological model based on these astronomical cycles can be used to well reconstruct the temperature oscillations since 1850 and to make partial forecasts for the 21st century. It is found that at least 60% of the global warming observed since 1970 has been induced by the combined effect of the above natural climate oscillations. The partial forecast indicates that climate may stabilize or cool until 2030-2040. Possible physical mechanisms are qualitatively discussed with an emphasis on the phenomenon of collective synchronization of coupled oscillators.


Tuesday, May 25, 2010

CO2 as a radiation valve contravenes the laws of thermodynamics

Email from Alan Siddons, a former radiochemist, to Greenie Watch (h/t):
...it's not only the Second Law (heat always flows to a cooler zone) which invalidates trace gas heating theory but the First Law as well (energy can neither be created nor destroyed). 

"Heat-trapping gases," you hear, and "Radiation goes in but can’t get out." Well then, what is every explanation of the greenhouse effect pointing at but a radiation valve? Since heat rays are prevented from exiting to space, it is claimed, they have nowhere else to go but back to the earth which, by absorbing them, becomes warmer.

The notion of a radiation valve snaps these concepts into focus: Without such a valve, it is imagined, infrared rays from the earth's solar-heated surface will pass freely into space. For every unit of sunlight going in, therefore, one unit of infrared goes out. Ergo, 1 - 1 = 0, zero referring to the heat gain. But with a proper valve in place no infrared is lost and the trapped rays are absorbed by the emitting surface, so the process goes thusly:


As you see, if the tenets of this theory are valid there can be no outcome other than a doubling of surface energy (a doubling at minimum, that is, since there's no reason to suppose that radiation from the now-warmer surface would not continue to be back-radiated, absorbed, and amplified in a "runaway" heating cascade).

As a real world application, such a valve could be approximated by common window glass or a dichroic filter. The irradiated surface could be anything similar to a blackbody, an ideal absorber-emitter, and a radiative heat gain of something above 0 would be observed. A working model of the greenhouse effect couldn't be made any simpler.

Simple as it is, though, no scientist in the world is able to construct a model that exhibits any radiative gain because the theory's tenets (called "the basic science") are not valid. On a theoretical basis alone, conservation of energy (the First Law) forbids a model like this from working. You can't obtain more energy than you put in. On an empirical basis too, however, as demonstrated by laboratory blackbodies, confined radiation only induces temperatures close to a theoretical blackbody limit, not a degree hotter. (The premise of greenhouse theory, remember, is that radiative confinement raises the earth's temperature above a blackbody limit, yet a laboratory blackbody --which is little more than a light trap -- exemplifies radiative confinement! The premise is self-contradictory.)

Monday, May 24, 2010

Time until All Glaciers and Ice Caps Melt at current rate: ~ 38,000 years

James Hansen of NASA/GISS says his grandchildren could inherit an ice-free earth, and that a warming ice-free earth would cause a sea level rise of 75m. According to recent estimates, about half (~1.6 mm/yr) of recent sea level rise is due to melting of ice sheets and glaciers, and the other ~half due to thermal expansion (both of which have been happening since the last major ice age). Assume also

1. Total volume of water on Earth: 1,260,000,000,000,000,000 m³
2. Total volume of water bound in icecaps and glaciers: 1.6% = 20,160,000,000,000,000 m³
3. Total volume of water in the oceans: 98% = 1,234,800,000,000,000,000 m³
4. Assume sea levels continue to rise at the same rate of 3.2 mm/yr by satellite altimetry (even though data indicates this is exaggerated and the rate is decelerating)

If all the ice in icecaps and glaciers melted, the total volume of water in the oceans would then be 1,254,960,000,000,000,000 m³, an increase of 1.6% from the present. Since the average depth of the oceans is 3790m, a 1.6% increase in volume would cause a sea level rise of 3790*.016 =  60.64m = 60640 mm. At the current rate of sea level rise over the past 18 years by satellite altimetry (a decelerating 3.2 mm/yr), half due to ice melt is 1.6 mm/year,  thus it will only take 60640/1.6 = 37900 years until all the ice in glaciers and icecaps melt at the current rate. Add to the fact that the Greenland and Antarctica ice sheets are currently increasing in volume and we are overdue for another ice age, the time is further postponed if ever. Not to mention, fossil fuels will run out within 200 years or less. 

The sea level has risen approximately 120m since the peak of the last major ice age approximately 20,000 years ago. Although the rate of sea level rise has greatly decelerated over the past 6000 years, the rate over the entire 20000 year period is 6mm/year. Substituting .5*6 = 3 mm for 1.6 above yields 20213  years until all ice is melted. Note: melting sea ice causes no significant change in sea level due to Archimedes principle.

Saturday, May 22, 2010

Greenland Ice Sheet Growing 5.4 cm/yr

According to an article published in Science, the thickness of the Greenland ice sheet as a whole has been growing at the rate of 5.4 cm/yr (following correction for isostatic uplift). The only areas thinning are selected coastal areas exposed to periodic warm ocean oscillations. This change is also consistent with the natural behavior of ice sheets.

Blue areas indicate increasing ice sheet thickness

Wednesday, May 19, 2010

Spotless Days hits 800

Today marks the 800th spotless day in the transition from solar cycle 23 to 24, placing this transition so far as the 3rd highest for number of spotless days over the last 14 solar cycles (since 1850).

Periods of low solar activity may secondarily affect climate via influence on cloud cover

Tuesday, May 18, 2010

Inconvenient Truth: Sea Level Rise is Decelerating

Despite alarmist claims* to the contrary, according to both tide gauge and satellite altimetry data, the rate of sea level rise since 1900 (and over the past 6000 years according to paleologic data) has been decelerating, not accelerating. Carefully selected tide gauge data by Simon Holgate of the UK Proudman Oceanographic Laboratory is shown in his poster below, which notes that the rate of sea level rise decelerated in the second half of the 20th century (despite exponential increases in CO2 emissions):
Furthermore, the rate of sea level rise as determined by satellite altimetry (which is only available since 1992 and is calibrated to tide gauges) has also decelerated over the past 5 years from 3.2 mm/yr to only 1.5 mm/yr, about the same rate as calculated by Holgate for the period 1954-2003. Paleologic data also indicate sea level rise has greatly decelerated over the past 6000 years, and that sea levels have been rising naturally since the last ice age.
Al Gore apparently doesn't need to be concerned about his purchases of  a $4.5 million condo and $8.8 million villa, both near the Pacific ocean.


*The recent NAS letter states that man-made global warming is causing "climatic patterns to change at speeds unprecedented in modern times, including increasing rates of sea level rise and alterations in the hydrologic cycle."

American Physical Society begins to Backpedal on Climate Policy

The Council of the American Physical Society (APS) has adopted on April 18, 2010 a "Climate Change Commentary" to append to their definitive and "incontrovertible" 2007 policy statement on climate change. The commentary allows considerable backpedaling from the prior policy while appearing to save face. The commentary removes the word incontrovertible because such words are "rarely used in science because by its very nature science questions prevailing ideas." The statement "While there are factors driving the natural variability of climate (e.g., volcanoes, solar variability, oceanic oscillations), no known natural mechanisms have been proposed that explain all of the observed warming in the past century." is added, and while not true since there are a number of papers which show that ocean oscillations and solar variability can explain all of the 0.7 degree warming of the past century, it is a step in the right direction from the 2007 policy which makes no mention of natural forcing and blames climate change on man-made emissions of CO2.

For the first time there is acknowledgement of the uncertainties associated with models, including the statement "These models have uncertainties associated with radiative response functions, especially clouds and water vapor. However, the models show that water vapor has a net positive feedback effect (in addition to CO2 and other gases) on global temperatures. The impact of clouds is less certain because of their dual role as scatterers of incoming solar radiation and as greenhouse contributors." While it is true the models show net positive feedback, that is only because that is how they were programmed, and no mention is made of the empirical satellite and weather balloon data which show the net feedback is actually negative. At least, the commentary begins to indicate large uncertainties with climate modeling.

The commentary adds "The uncertainty in the estimates from various climate models for doubling CO2-equivalent concentration is in the range of 1°C to 3°C with the probability distributions having long tails out to much larger temperature changes.", without mentioning that 1°C global warming is what is expected from the no feedback model and even less from the negative feedback model as supported by data, which is likely to be beneficial and is hardly cause for alarm or cap & tax schemes. As Richard Lindzen and Roy Spencer have repeatedly pointed out, the real issue to be determined is the sensitivity of the climate to changes in CO2, for which all the empirical data show the models have greatly overestimated sensitivity. If there is low sensitivity, there is no cause for alarm.

Here is the original 2007 policy, followed by the new Commentary:

Monday, May 17, 2010

Sea Level Expert: Recent Sea Level Change Exaggerated

The study "Comparison of Sea Levels measured by Satellite Altimetry and by Tide Gages" by Cyril Galvin PhD is the subject of the May 20th meeting of the Potomac Geophysical Society. 
Abstract:
“Present-day sea level change: Observations and causes” appeared in Reviews of Geophysics (2004). Its authors claim “global mean sea level rise is now known to be very accurate, 2.8+/-0.4mm/yr”, a rate “significantly larger than the historical rate of sea level change measured by tide gages during the past decades (in the range of 1-2mm/yr)”. The 2004 paper has been cited in the literature at least 115 times (in Web of Science database, as of 14 April 2010), usually to support a very recent acceleration of sea level rise. Tide gages have operated for centuries; satellite altimetry has been around for two decades. Both gages attempt to measure the elevation of the sea surface. The tide gage is immersed in the sea surface, the satellite altimeter orbits 100 miles away. In April 2003, I selected 14 tide gages from US coasts whose data are collected by NOAA and archived by PSMSL. The 14 are located at or near ocean coasts and have data for quarter points of the 20th century (1925, 1950, 1975, 2000). The identity of these gages was published in The New York Review of Books, 14 August 2003, a year before publication of the 2004 article quoted above. Using their study decade, 1993-2003, seven of the 14 tide gages showed lower, and seven showed higher sea levels in 2003 than in 1993. Average changes in sea level at the 14 pre-selected gages were 0.36mm/yr. This is an order of magnitude less than 2.8mm/yr quoted above for the 2004 satellite data. Further, the 14-gage average sea level is actually less than the standard deviation of the satellite altimetry data. The rate of sea level change quoted for satellite altimetry in the opening sentences above is unlikely to be correct."
Biographical Information:
Cy Galvin PhD is believed to be the first practicing coastal engineer, and he remains the longest continuously operating consulting coastal engineer. He received a BS in Geological Engineering from St Louis University (thesis: Grover Gravel, 1957); a SM from MIT (thesis: Deformed Devonian Brachiopods from Maine, 1959); a PhD from MIT (Experiments on Longshore Currents, 1963). ASCE awarded him their Norman Medal and Huber Research Prize for his experiments on water waves. He has studied sea level problems for about 30 years and has interests in science and public policy, as represented by the controversy on global warming. 
Added note: Satellite altimetry is calibrated to tide gauge data and has been repeatedly "adjusted" over the years, including recently adjusted data collected up to 18 years ago. 

Saturday, May 15, 2010

Mainstream US Media begins Balanced Reporting on Global Warming

A report on the CBS Evening News tonight titled Forecast: Global Warming points out that the recent George Mason University poll of TV weather forecasters shows only 31% believe global warming is primarily caused by man. {and over 25% went so far as to call it a scam}

The segment features John Coleman and Dr. Roy Spencer, and a TV weatherman named Dan Satterfield, who undermines his own pro-AGW position by stating "I try to figure out what the weather is going to do in 3 to 5 days - and that isn't easy. The natural thing to think is how can they possibly tell me what the weather is going to do in 100 years?"
Transcript
Related CBS videos: Climategate a hot debate
Getting hot and bothered over climategate

Friday, May 14, 2010

An Engineer's Critique of Global Warming 'Science'

Burt Rutan has recently updated his pdf presentation with much new material and it is highly recommended:
 

Wednesday, May 12, 2010

Potential cost of Kerry-Lieberman Cap & Tax: $69 - $145 Billion per Year

The Kerry-Lieberman Cap & Tax bill establishes a price collar for CO2 emissions with a floor of $12 per metric ton (increasing annually by 3% + inflation) and ceiling of $25 (increasing annually by 5% + inflation). According to the EPA, US emissions of CO2 in 2009 were 5787 million metric tons. Thus, if the legislation is applied to all US emissions, the cost would be $69 Billion (floor) to $145 Billion (ceiling) annually, increasing ~6 to 8+% each year forever.

More Headlines from THE (one & only) "Settled Science"

Headline last week: Plants Making Global Warming Worse!
Headline this week: Plants Cooling Midwest!


Both studies state that plants affect climate via water vapor - but last week the water vapor was to be increasingly retained by plants thus increasing warming, and this week water vapor is being increasingly released by plants to decrease warming. 


Are farmers cooling Chicago's summers?
May 11, 2010|By Joel Hood, CHICAGO TRIBUNE
Amid one of the warmest springs on record in Chicago, and renewed worries about our warming planet, how is that late summer days across the Midwest are cooling?
The answer may be in the towering, tightly packed rows of corn that blanket Illinois at harvest and the ripple effects from industrialized farming that scientists are only beginning to understand.
In the last 80 years, those lazy, late summer days in July and August have been getting cooler and wetter throughout much of the Midwest. In Chicago, temperatures reached 90 degrees or higher 344 days during the 1930s, but only 172 days in 2000-09.
In place of those dry, 90-degree scorchers are the kind of lingering 80-degree days with higher humidity that don't cool down much at night. Climate scientists say the cause is rising dew-point levels — the measure of water vapor in the atmosphere.
These high dew-point levels are important, said David Changnon, a climate scientist at Northern Illinois University who helped pioneer this research, because even though the temperature is lower, the heat index is higher. And that's bad news for many city dwellers, since those conditions contributed to the deadly heat waves that hit Chicago in 1995 and 1999.
Already, these cooler but muggy late-summer days are likely to be producing more powerful thunderstorms and periods of heavier rain that bear watching, Changnon said.
"While we're seeing fewer really hot days, we've created dew points in Chicago and around the Midwest that are unheard of," Changnon said. "And it begs the question, 'How the heck can we do that?'"
Changnon's theory, backed by more than a decade of research, is that more densely planted corn and soybean fields scattered across the Midwest are changing the regional climate by releasing more water vapor into the atmosphere. The more water vapor that reaches the atmosphere, the higher the dew point, and the fewer extremely hot summer days.
In other words, while some still question whether people are to blame for changing weather patterns around the globe, farmers around the Midwest are already altering the region's climate in significant ways, Changnon said.
"It's a different type of human-induced climate change that has certainly played a role in the changes to Illinois' weather," said Jim Angel, a climatologist at the Illinois State Water Survey in Champaign. "It's kind of an interesting way to look at all this."

Related: Biofuels making global warming worse and cause 4 times more carbon emissions
Cocaine users Making Global Warming Worse

Tuesday, May 11, 2010

Most NAS letter signatories not related to climate science

According to an audit of the recent open letter signed by only 12% of the members of the National Academy of Sciences, of that 12%, only 26.7% work in areas related to climate. The majority are life and medical scientists at 58.4%. The total of 255 signatories is less than 1% of the 31,000 scientists who have signed the Oregon Petition, which states humans are not responsible for causing a global warming crisis.


note: photoshopped image above was removed after being exposed as fake. see also here and here. A real photo of polar bears. Polar bear populations up 400%.

Sunday, May 9, 2010

New SPPI paper on Ocean Acidification

Since the CO2 causes catastrophic global warming schtick hasn't worked out, many alarmists have now turned their focus onto another imaginary problem: CO2 causing "acidification" of the oceans. A new SPPI paper by Lord Monckton exposes the fallacy.
Key points:
  • Doubling of atmospheric levels would only increase dissolved CO2 in the oceans by .48%
  • There is no reliable evidence that ocean pH is falling
  • Increased CO2 dissolution in the oceans increases calcification of shellfish and coral
  • Corals evolved at a time when CO2 levels were 15 times higher than the present
  • Laboratory experiments on sealife in which hydrochloric acid is added to the water (not CO2) and without the natural buffers present in the ocean is meaningless to determine effects of increased CO2 levels on sealife.
Other recommended resources on "Ocean Acidification":

Saturday, May 8, 2010

Mars has warmed 4 times more than Earth over last 20 years

According to the SETI Institute, "in early April of this year, a young Carl Sagan Center Principal Investigator named Lori Fenton, together with her colleagues at NASA Ames Research Center and the USGS in Flagstaff Arizona, published an article in the journal Nature revealing the phenomenon of the rise in the Martian global temperature over the past 20 years. The rise, less than 2° for both surface and air temperature, is still significant from a geologic perspective."..."Such a change is very intriguing and has never before been seen on any planet."


Since satellite data indicates the earth has warmed less than 0.4°C over the same time frame, Mars is warming four times faster than Earth. 


Could it be the sun?
Mars Lander - only known anthropogenic vehicle on Mars

Friday, May 7, 2010

Was Nashville's flood caused by global warming?

Apparently, head of the National Center for Atmospheric Research Kevin Trenberth thinks so. However, according to the US Climate Extremes Index for precipitation, there has been no trend in US precipitation over the past 100 years:
Above graph from the US Climate Extremes Index shows the sum of the percentage of the United States with a much greater than normal number of days with precipitation plus the percentage with a much greater than normal number of days without precipitation. Five year mean is shown in green.

Climate scientists frequently like to have it both ways, claiming that anthropogenic global warming causes both increased precipitation and increased droughts.

Did anthropogenic global warming also cause the highest recorded flood in Nashville in 1926 & 1927 according to the US Army Corps of Engineers? And severe Nashville flooding in 1937, 1975, and 1977?


UPDATE: Floods 10X More Likely During Global Cooling Periods Vs. Global Warming Periods, EU Scientists Discover

UPDATE 2: The flood peak on the Cumberland River in downtown Nashville ranks as only the tenth highest in more than 200 years of record at that site.

Thursday, May 6, 2010

A Battle for Sensitivity

"Sensitivity" to a climate scientist refers to the expected change in global temperature due to a doubling of CO2 levels. Thus far, all papers which have calculated sensitivity on the basis of empirical satellite or weather balloon data have found sensitivity to be far less than what is assumed by the computer models of the IPCC. A highly recommended new paper by Dr. Bill Gray adds to the list of papers which find sensitivity to be quite low: 0.5°C due to a doubling of CO2:
GCMs=General Circulation Models
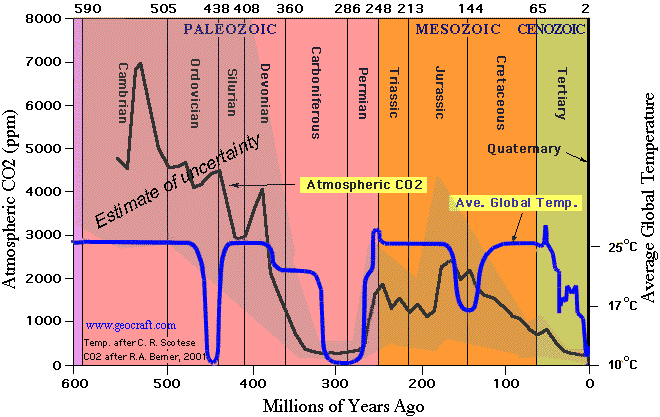
This paper (and all of the other papers based on empirical data) finds increased CO2 leads to a negative feedback upon water vapor, rather than positive as assumed by the IPCC. The 0.5°C sensitivity is in very close agreement with all of the other papers based on empirical data rather than virtual computer models. Meanwhile, Gavin Schmidt et al at NASA/GISS continue to fiddle with their computer models rather than test them against inconvenient satellite data, and lo and behold come to the conclusion that the IPCC models underestimate sensitivity 30-50%. Gavin makes this proclamation on the basis of computer modeling of the climate 3 million years ago, which given the unproven assumption that CO2 controls all, would require higher climate sensitivity to account for higher temperatures during the Pliocene (2.5-5.5 million years ago). However, had Gavin done the same with the rest of the geologic record -600 million years of which are shown below - he could not possibly come to the same conclusion since CO2 levels show no correlation with temperatures, and CO2 levels were up to 18 times higher than the present throughout an entire ice age about 450 million years ago:

 The NASA/GISS/IPCC models are disproven by satellite and balloon data and by the geologic record.

UPDATE: Dr. Roy Spencer's post today also finds climate sensitivity to be 0.5°C and states:
"These results suggest that the sensitivity of the real climate system is less than that exhibited by ANY of the IPCC climate models. This will end up being a serious problem for global warming predictions. You see, while modelers claim that the models do a reasonably good job of reproducing the average behavior of the climate system, it isn’t the average behavior we are interested in. It is how the average behavior will CHANGE.

And the above results show that not one of the IPCC climate models behaves like the real climate system does when it comes to feedbacks during interannual climate variations…and feedbacks are what determine how serious manmade global warming will be."

Wednesday, May 5, 2010

EIA Reports Record-setting 7-percent Decline in 2009 U.S. CO2 Emissions‏

CO2 emissions declining without the "help" of legislation
EIA FOR IMMEDIATE RELEASE  MAY 5, 2010

In 2009, energy-related carbon dioxide emissions in the United States saw their largest absolute and percentage decline (405 million metric tons or 7.0 percent) since the start of U.S. Energy Information Administration's (EIA) comprehensive record of annual energy data that begins in 1949.

Today EIA released an analysis of the factors affecting this decline. "The large decline in emissions was driven by the economic downturn, combined with an ongoing trend toward a less energy-intensive economy and a decrease in the carbon-intensity of the energy supply," said EIA Administrator Richard Newell.

In addition to a decline in gross domestic product (GDP) in 2009 of 2.4 percent, the energy intensity of the economy (energy consumed per dollar of GDP) declined 2.4 percent and the carbon intensity of the energy supply (carbon dioxide per unit of energy consumed) declined by 2.3 percent. The latter two factors led to a decline in the overall carbon intensity of the economy (carbon dioxide per dollar of GDP) of over 4.5 percent between 2008 and 2009.

The Insanity of California's Greenhouse Gas Legislation

Cost to "avoid" global warming: $1.3 Quadrillion per Degree

Suspend disbelief for a moment and just assume that man-made CO2 causes global warming...
And assume that California's Global Warming Solutions Act (AB 32) goes into effect and is not delayed by the increasingly impoverished citizens of California... what would the cost/assumed benefits ratio be?

Let's do a back-of-the-envelope calculation, since it apparently wasn't done by California legislators:

  • USA accounts for 19.3% of global anthropogenic CO2 emissions
  • California has 12% of the US population
  • Percent reduction of California anthropogenic emissions by 2020 (AB 32 goal): 25%
  • Global CO2 man-made emissions (2006): 30.2 billion tons

Thus, if AB 32 meets its goal of reducing California CO2 contributions 25% by 2020 (unlikely), the California reduction of global man-made CO2 emissions would be approximately:

30,200,000,000*.193*.12*.25= 174,858,000 tons

And since:
  • Global man-made CO2 emissions since 1/1/60 are 1 trillion tons
  • Global warming since 1/1/60 is claimed to be ~0.5°C
  • The IPCC assumes almost all (97%) global warming is due to man-made CO2 and that man-made CO2 remains in the atmosphere hundreds to infinite years

Thus, global warming per ton of man-made CO2 would be 0.5/1,000,000,000,000 = 0.0000000000005°C per ton

Thus, the "global warming avoided" due to AB 32 would be 174,858,000*.0000000000005 = 0.000087429°C (about 9 hundred thousandths of 1 degree)

and since the cost of AB 32 (direct & indirect) is at least $116 Billion, the cost to "avoid global warming" per 1°C would be  $116,000,000,000/.000087429 = $1,326,790,881,744,043 ($1.3 Quadrillion per degree). Note: Global GDP (61.1 trillion) is less than 5% of this amount. Looks like the cost/(assumed benefits) ratio is rather high, even if you are a true believer.

Monday, May 3, 2010

Shapiro to Chair InterAcademy Council's IPCC Review Committee

05/03/10: Harold T. Shapiro (CV), an economist and president emeritus of Princeton University, has been selected by the InterAcademy Council (IAC), an organization of the world's science academies, to chair a 12-member committee to conduct an independent review of the procedures and processes of the Intergovernmental Panel on Climate Change (IPCC). The review was requested last month by the United Nations.

The committee will review IPCC procedures for preparing its assessment reports. Among the issues to be reviewed are data quality assurance and control; the type of literature that may be cited in IPCC reports; expert and government review of IPCC materials; handling of the full range of scientific views; and the correction of errors that are identified after a report has been completed. The committee also will review overall IPCC processes, including management functions and communication strategies.

The IAC plans to deliver a peer-reviewed report with the committee's findings and recommendations to the U.N. by Aug. 30.

Dr. Lindzen's New Paper: 0.7°C temperature change from doubled CO2

Drs. Lindzen's & Choi's new draft paper has been submitted to the Journal of Geophysical Research. The paper updates and responds to criticisms of their 2009 paper, but arrives at essentially the same conclusions. They find on the basis of empirical satellite observations that the climate sensitivity to a doubling of CO2 levels is a mean of 0.7°C, implying net climate feedbacks from water vapor, clouds, etc. are negative, not positive as assumed by all IPCC models, and thus all IPCC models exaggerate warming due to increased CO2. This is in close agreement with other peer reviewed papers which have examined empirical satellite and radiosonde data.

From the abstract: "We again find that the outgoing radiation resulting from SST fluctuations exceeds the zero-feedback fluxes thus implying [net] negative feedback."

UPDATE: Full published paper available here

From p. 385:

"As a result, the climate sensitivity for a doubling of CO2 is estimated to be 0.7K (with the confidence interval 0.5K -1.3K at 99% levels). This observational result shows that model sensitivities indicated by the IPCC AR4 are likely greater than the possibilities estimated from the observations."

24 Abstract

25 To estimate climate sensitivity from observations, Lindzen and Choi [2009] used the
26 deseasonalized fluctuations in sea surface temperatures (SSTs) and the concurrent responses in
27 the top-of-atmosphere outgoing radiation from the ERBE satellite instrument. Distinct periods of
28 warming and cooling in the SST were used to evaluate feedbacks. This work was subject to
29 significant criticism by Trenberth et al. [2009], much of which was appropriate. The present
30 paper is an expansion of the earlier paper in which the various criticisms are addressed and
31 corrected. In this paper we supplement the ERBE data for 1985-1999 with data from CERES for
32 2000-2008. Our present analysis accounts for the 36 day precession period for the ERBE satellite
33 in a more appropriate manner than in the earlier paper which simply used what may have been
34 undue smoothing. The present analysis also distinguishes noise in the outgoing radiation as well
35 as radiation changes that are forcing SST changes from those radiation changes that constitute
36 feedbacks to changes in SST. Finally, a more reasonable approach to the zero-feedback flux is
37 taken here. We argue that feedbacks are largely concentrated in the tropics and extend the effect
38 of these feedbacks to the global climate. We again find that the outgoing radiation resulting from
39 SST fluctuations exceeds the zero-feedback fluxes thus implying negative feedback. In contrast
40 to this, the calculated outgoing radiation fluxes from 11 atmospheric GCMs forced by the
41 observed SST are less than the zero-feedback fluxes consistent with the positive feedbacks that
42 characterize these models. The observational analysis implies that the models are exaggerating
43 climate sensitivity.